A game reports more than ninety frames per second but briefly freezes when you turn or enter a new area. Average FPS has not stopped working; it answers a coarse question: how many frames were produced over that interval? Whether those frames arrive at a consistent rhythm requires examining their timing.
Start with frame time, then decide what deserves further measurement. A single bottleneck percentage or one drop in GPU utilization cannot tell you which component to replace.
A long frame can hide behind a decent average
Under ideal uniform output, the frame interval in milliseconds is approximately 1,000 ÷ FPS. Thus 60 FPS corresponds to about 16.67 ms and 120 FPS to about 8.33 ms. This is a time conversion, not a computer benchmark.
Suppose a recording contains 100 frames: 99 take 10 ms each and one takes 100 ms. Total time is 99 × 10 + 100 = 1,090 ms. Dividing total frames by total duration gives about 91.74 FPS. The average looks respectable, but one wait is still much longer.
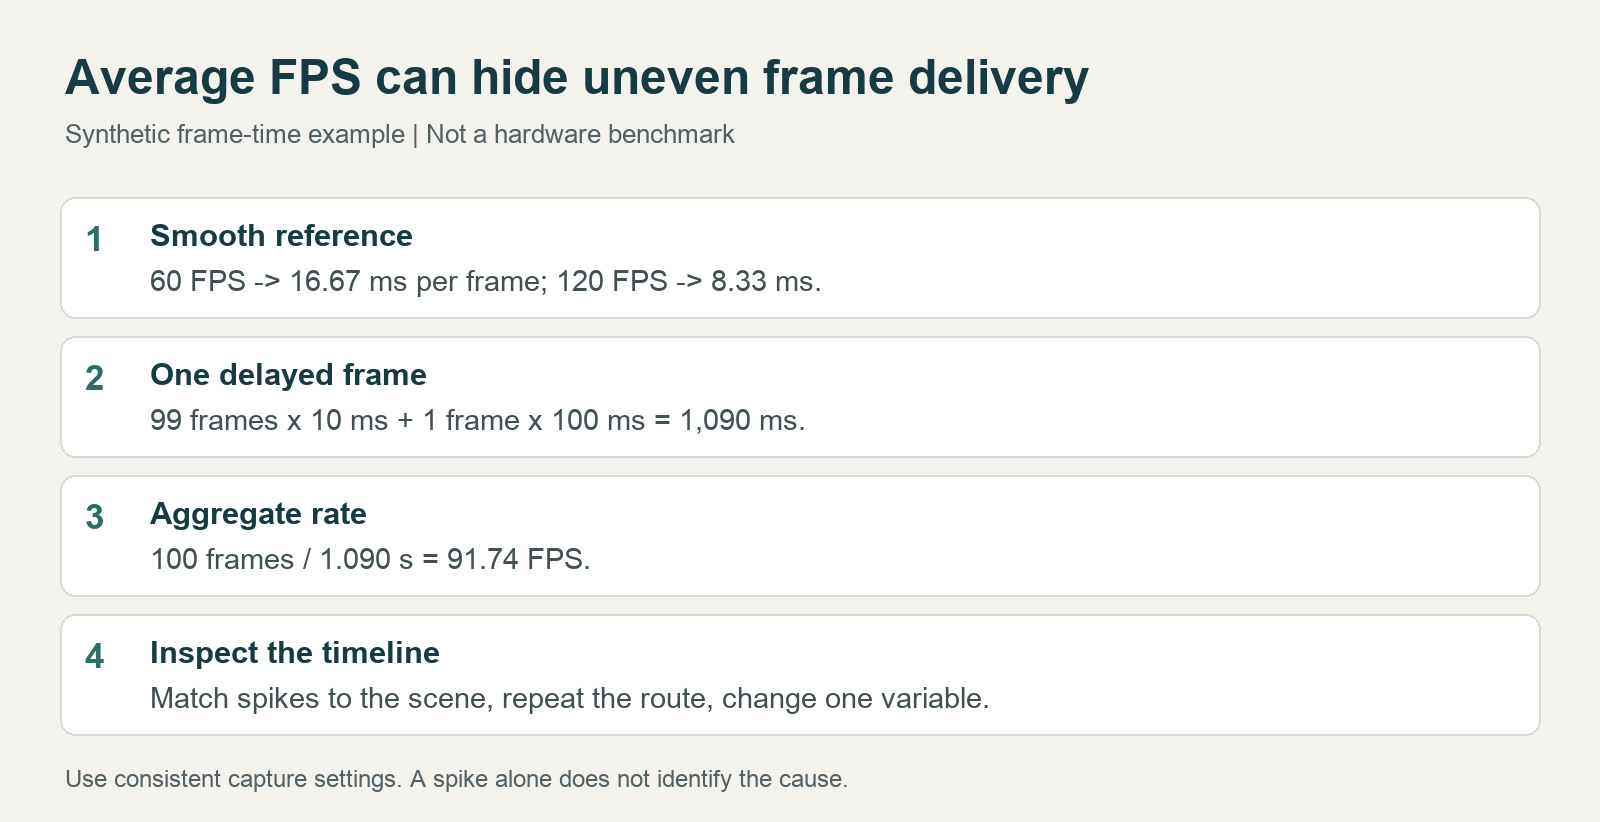
Figure: a synthetic frame-time calculation and checking workflow, not a game benchmark screenshot.
The arithmetic mean of instantaneous per-frame FPS also differs from total frames divided by total duration. Sampling windows, inclusion of loading screens and the tool's statistical definition can all change the final number.
Another useful quantity is how much time slow frames occupy. In a hypothetical 60-second recording with six 100 ms frames, those six frames alone take 0.6 seconds, or 1% of the interval. This is still a synthetic calculation, but it preserves rare pauses that a percentile may omit.
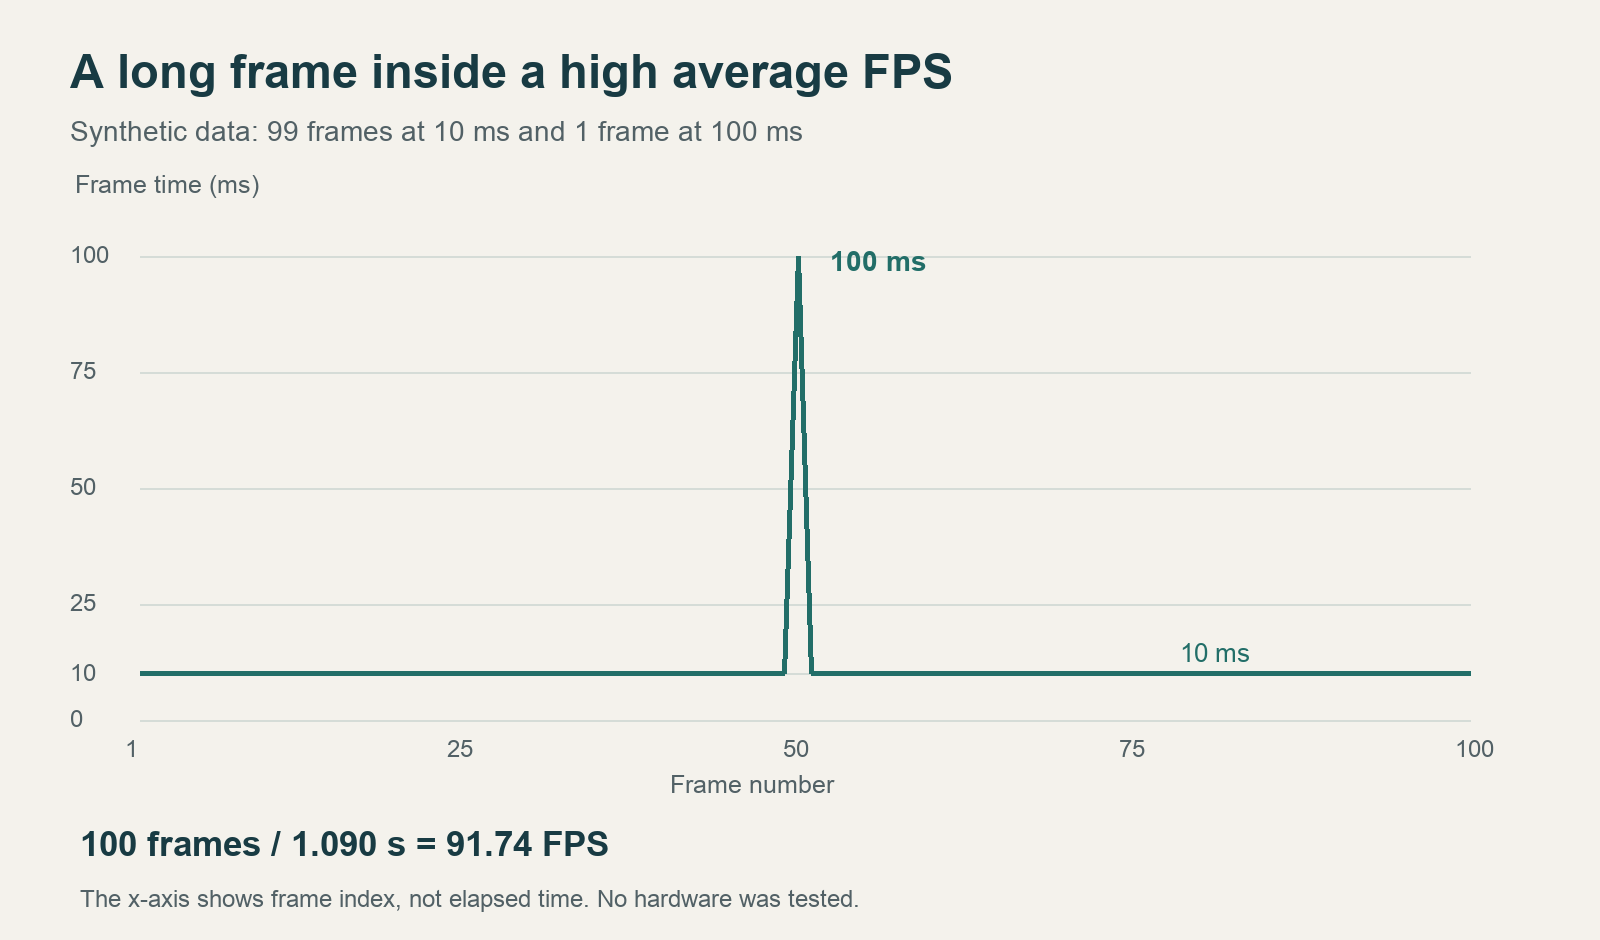
Figure: 100 synthetic frames. The horizontal axis is frame index, not equally spaced time. Frame 50 takes 100 ms; the other 99 take 10 ms each.
Establish what kind of frame was recorded
NVIDIA's official FrameView page lists frame-rate, frame-time and power measurements, with logging support.[1] Logs preserve data around an event, but a recording tool alone cannot prove “this is a CPU bottleneck.”
Before comparing reports, check rendered versus displayed frames, frame generation, V-sync and frame caps. Mixing generated and base-rendered frames can increase the number without proportionally improving input response. Display-path problems may also fall outside a rendering log, so a smooth log cannot rule out every visible stutter.
“1% low” helps examine poor frame performance, but software may calculate it differently. Keep the tool name, version, metric definition and recording duration with the number. Do not assume it is the slowest single frame or combine different tools into a ranking.
CapFrameX explicitly distinguishes frame-ranked percentiles from elapsed duration.[3] “99% of frames meet a threshold” cannot strictly become “99% of play time is smooth,” because a few slow frames may occupy substantial time. It also discusses percentile values versus summaries of the slowest fraction. If a report only labels “1% low” without a calculation method, retain that limitation.
Which log fields should be read together?
Open the CSV and check its headers first. PresentMon's console documentation defines the following fields; actual output depends on version and capture options.[2]
| Field | Documented meaning | What it can help investigate |
|---|---|---|
MsBetweenPresents |
Time between adjacent Present calls | Whether application submission suddenly slows |
MsCPUBusy |
CPU work before this frame is submitted | Changes in CPU-side work around a long frame |
MsGPUBusy |
GPU active work for this process's frame | Whether graphics work grows heavier with the scene |
DisplayLatency |
Time from the frame's start to display | Waiting in the display path |
DisplayedTime |
How long the frame is shown; may be NA if not displayed | Whether a frame stays on screen unusually long |
These fields describe different intervals, and CPU and GPU work can overlap. Do not simply add columns and require the sum to equal total frame duration. MsGPUBusy is not Task Manager's GPU-utilization percentage. Read the definitions before deciding whether two numbers are comparable.
If submission intervals lengthen and GPU active time rises markedly, graphics work deserves investigation. If GPU work is short but waiting is long, frame caps, CPU supply or scheduling may contribute. The latter narrows the search; it does not establish insufficient CPU performance. The project also documents limits under different APIs and hardware scheduling. Leave missing or constrained fields as they are.[4]
Preserve evidence with a repeatable short route
Choose a route you can repeat, fixing resolution, graphics settings, camera movement and frame cap. Save the original settings, start logging and keep the output after finishing. Label files with game version, graphics driver, scene and settings for later comparison.
For each spike, note whether it occurs on first entry, a sudden camera turn, a background program starting or every pass through the same location. Examine available CPU, GPU, memory and storage metrics together. Do not fill uncaptured sensor fields with zero.
Repeat three times initially and save each result. If differences are large, check scene, temperatures, caches and background tasks before extending or adding tests. Keeping only the best run removes the variation you need to explain.
The following is a starter template. Sixty seconds and three runs are illustrative, not guaranteed sufficient for every game.
| Record | Example |
|---|---|
| Segment | Start from a fixed save and follow the same route for 60 seconds |
| Cold-start record | Keep the first scene entry separately |
| Repeats | Three runs with the same settings, separate CSV files |
| Exclusions | Decide before capture whether menus and loading screens count |
| Variable this round | Lower shadows only; keep everything else unchanged |
Compare cold starts separately from already visited scenes. First-load stutter deserves its own record. For sustained graphics load, do not mix first-load data in one group with warmed-up data in another.
PresentMon supports choosing a process by name, setting capture duration and selecting a CSV output file.[2] With either a GUI or command line, confirm the target process to avoid combining launcher and game frames. No actual game capture was performed here; the images illustrate metrics.
Change one condition at a time
If you suspect graphics load, reduce one defined rendering burden and repeat the route. For suspected background interference, close one known program and retest. Do not simultaneously change drivers, graphics quality, frame caps and restart the game, or the cause of improvement will be unclear.
If lowering quality raises average FPS but a spike remains at the same place, average rendering load and that pause may be different problems. A first-pass stutter that eases later may involve asset loading or caching, but that pattern alone does not identify the cause. Low GPU utilization may reflect a cap, waiting for the CPU or other limits; it does not directly mean inadequate graphics-card performance.
Save a conclusion tied to conditions, such as “all three runs spiked on entering the area, and lowering shadows did not remove the spike,” rather than “the PC has a 30% bottleneck.” The next test can then examine the spike location and the shadow-setting difference without starting from guesses again.
References
-
NVIDIA FrameView official page. Supports frame-rate, frame-time and logging capabilities. Does not indicate a test was run, identical power fields across GPUs or installed software.
-
PresentMon Console Application documentation. Main-branch snapshot read on 2026-09-27. Defines CSV fields, target process and capture duration. Fields vary by version; no local capture is implied.
-
CapFrameX: Explanation of different performance metrics. Taxxor, 2020-05-31. Explains percentiles and x% low. Used for metric concepts, not as a current-interface screenshot.
-
PresentMon project documentation and limitations. Checked 2026-09-27. APIs and hardware scheduling can affect measurement; record the environment instead of directly inferring a bottleneck.
